Your server doesn’t care that you’re away from your desk. Disks fill up on weekends, containers die at dinner, and the “is it down or is it just me” question always arrives when the only computer within reach is the one in your pocket.
The good news: a phone is a perfectly capable monitoring station. Here are the four approaches that actually work, with the trade-offs of each.
Table of contents
Open Table of contents
Option 1: A plain SSH client and your own two hands
Any SSH client (Termius, Blink, JuiceSSH, or the one below) gets you a shell, and a shell gets you everything:
# The 60-second health check
uptime                    # load averages
free -h                   # RAM and swap
df -h                     # disk usage per mount
systemctl --failed        # anything that crashed
docker ps                 # containers still standing?
journalctl -p err -n 50   # recent errors
Works because: zero setup on the server, works on any box you can SSH into.
Falls short because: it’s pull-only. The server can’t tap you on the shoulder — you find out the disk was full after you thought to check. And typing journalctl --since "1 hour ago" on a phone keyboard builds character you didn’t ask for.
Option 2: Self-hosted dashboards (Grafana, Netdata, Cockpit)
Install Netdata or Prometheus + Grafana on the server, open the dashboard in your phone’s browser.
Works because: beautiful graphs, deep history, and alerting if you configure it.
Falls short because: now you’re running monitoring infrastructure. You need to install and update an agent, secure a web port or set up a VPN/tunnel, and the mobile browser experience ranges from “fine” to “pinch-zoom archaeology.” For a fleet at work: worth it. For three VPSes: a lot of ceremony.
Option 3: Monitoring SaaS (UptimeRobot, Datadog, and friends)
Point an external service at your server, get push notifications when something’s wrong.
Works because: real push alerts with no self-hosted infrastructure, and uptime checks see your server the way the internet does.
Falls short because: the useful tiers cost money per host per month, deeper metrics need an agent installed on the server, and your monitoring now depends on a third party holding credentials or running code on your box. Also, when an alert fires, you still need something else to actually fix the problem.
Option 4: A mobile-first SSH client with monitoring built in
This is the gap Cura was built for: one app that is both the dashboard and the terminal, designed for a phone screen, with no agent on the server — it reads everything over plain SSH.
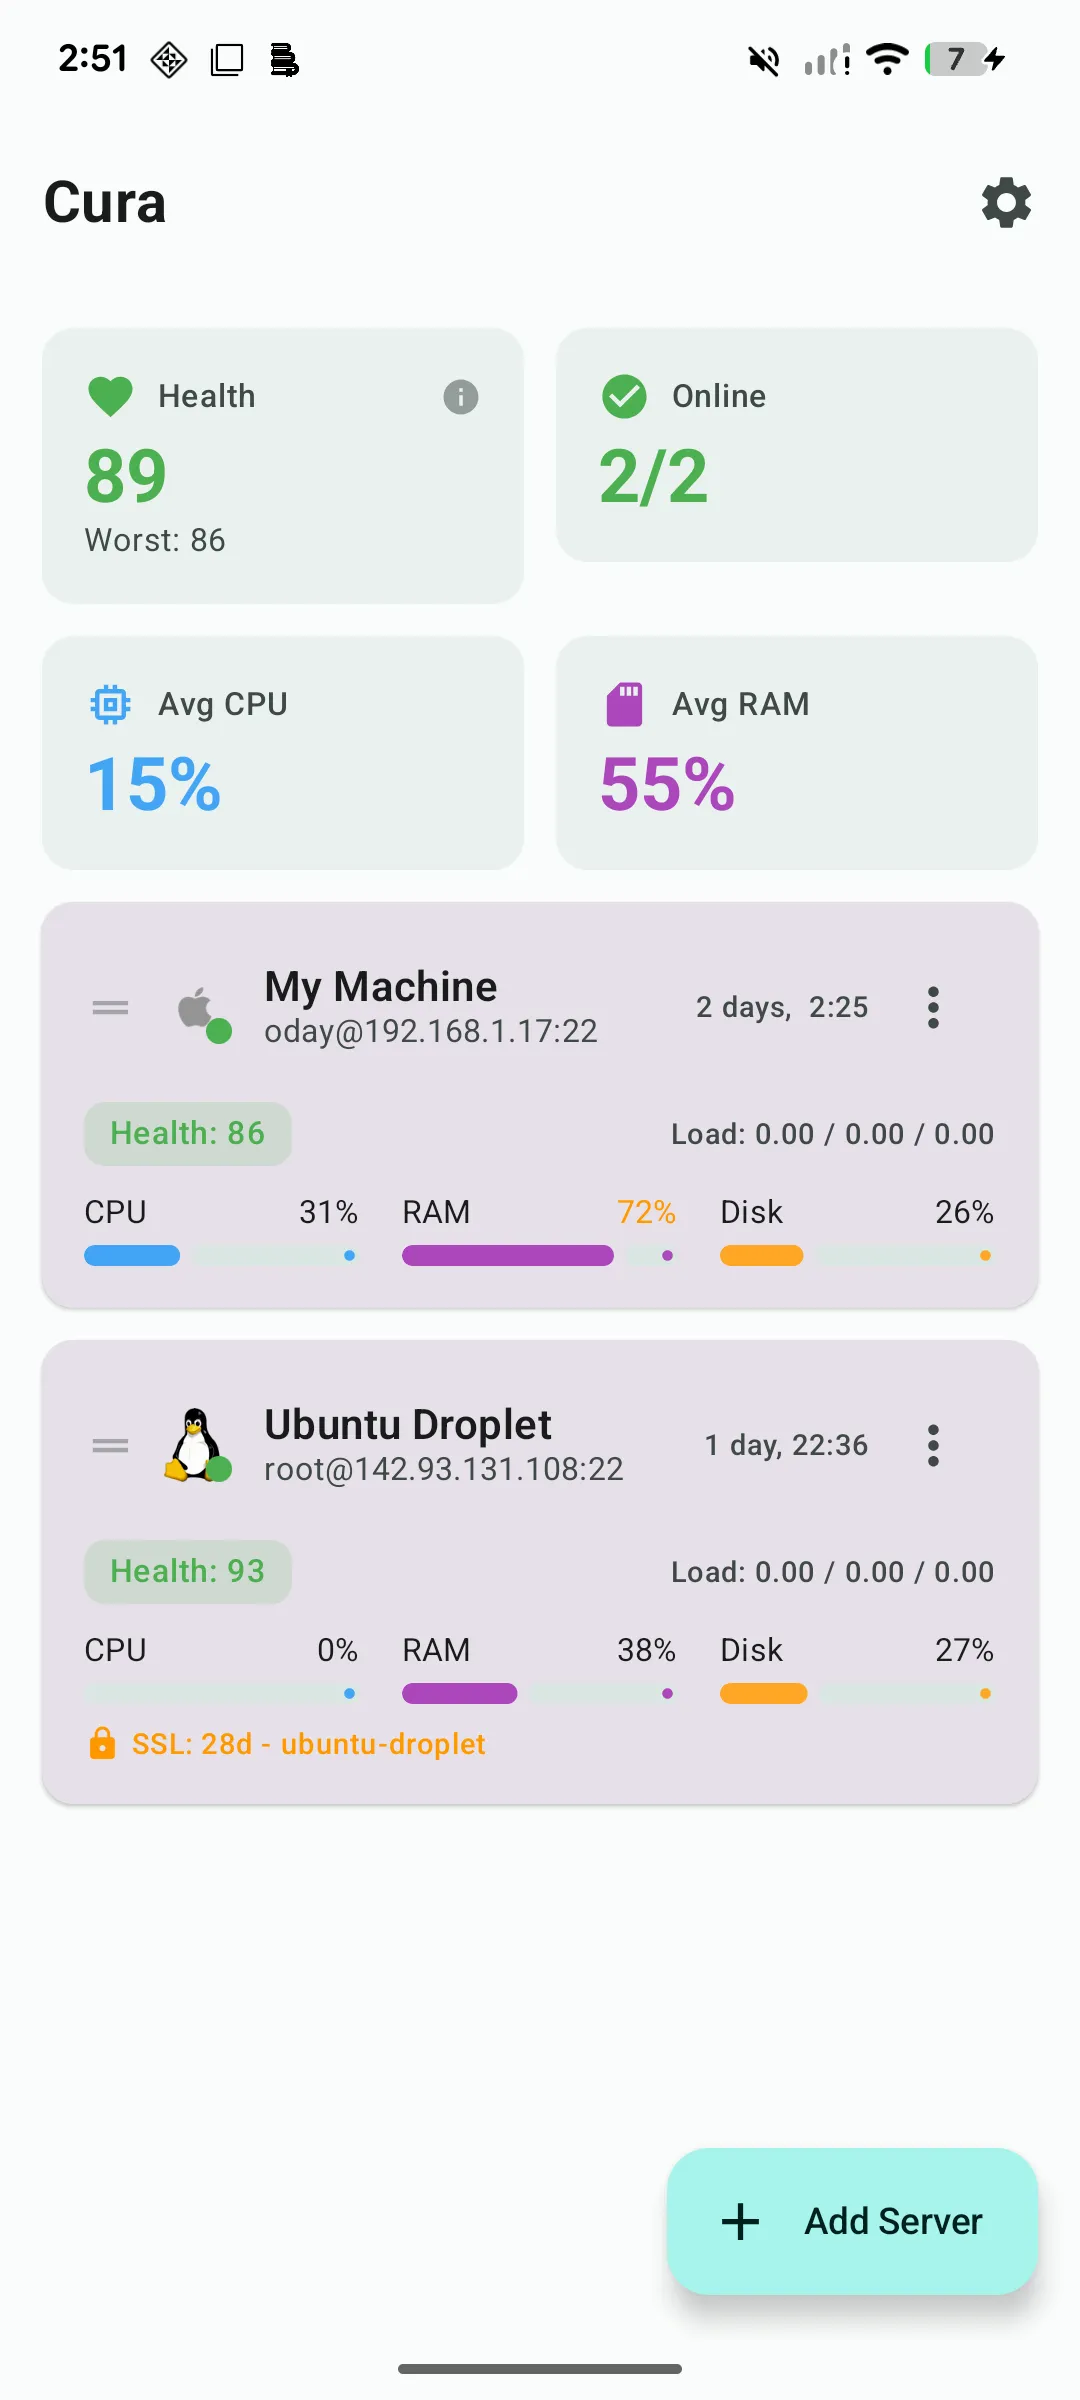
What that looks like in practice:
- Live stats — CPU, RAM, disk, and network per server, sampled over SSH, no exporter or agent installed
- Alerts — get pinged when CPU, RAM, or disk crosses a threshold, or when SSL certificates approach expiry
- A real terminal — the moment a stat looks wrong, you’re one tap from a shell on that box
- Docker management — list, restart, and inspect containers without typing
- Runbooks — your
uptime && free -h && df -hritual saved as a one-tap sequence - Log tailing — head or tail any log with configurable line counts
The free tier covers one server with full terminal access; Pro is a $9.99 one-time purchase (no subscription) for unlimited servers and alerting.


Which one should you pick?
- One server, occasional check-ins → plain SSH client is fine
- A fleet at work with a team → Grafana/Prometheus or a SaaS, properly set up
- Public uptime is the only thing that matters → UptimeRobot-style external checks
- A handful of personal or client servers you actually administer from anywhere → a mobile-first tool like Cura covers monitoring, alerting, and the fix in one app
The honest summary: dashboards tell you something broke, SaaS pings you that it broke, but on a phone you also want to be one tap from the shell that unbreaks it.